
Usage Dashboard

Getting started

The Usage dashboard provides the aggregated information about the amounts of regulated data transferred within the scope of your organization.

note

Usage dashboard of the InCountry Portal may show no data and statistics upon the first sign-in to the system.

To view the dashboard, on the sidebar, select Usage. The Usage dashboard opens, as follows:

The Usage dashboard provides two views:

  • Map - it shows the map of the countries into which you loaded data or performed other data operations (such as reads or deletions).

  • Table - it shows the table with the aggregated number of data transactions to specific countries.

To switch between the map and table views, use the view switch on the dashboard.

Usage dashboard - Map view

The map on the dashboard shows all the countries which you transferred regulated data to or performed any data management operations (reads or deletions). The frequency of performed data operations to countries is indicated with the color density. The darker the color, the more data management operations were performed.

Above the map, you can select what information you want to view, as follows:

  • Records - number of records stored in a specific country.

  • Transactions - number of performed data transactions.

  • Files - number of files uploaded to the InCountry platform.

Below the map with countries, you can locate the additional buttons for performing the following operations:

ButtonAction
Click this button to fit the map to the available display area.
Use this button to zoom in (+) or zoom out (-).

Usage dashboard - Table view

To view the table with aggregated transaction data, select the Table view. The table view loads as follows:

Above the map, you can select what information you want to view, as follows:

  • Records - number of records stored in a specific country.

  • Transactions - number of performed data transactions.

  • Files - number of files uploaded to the InCountry platform.

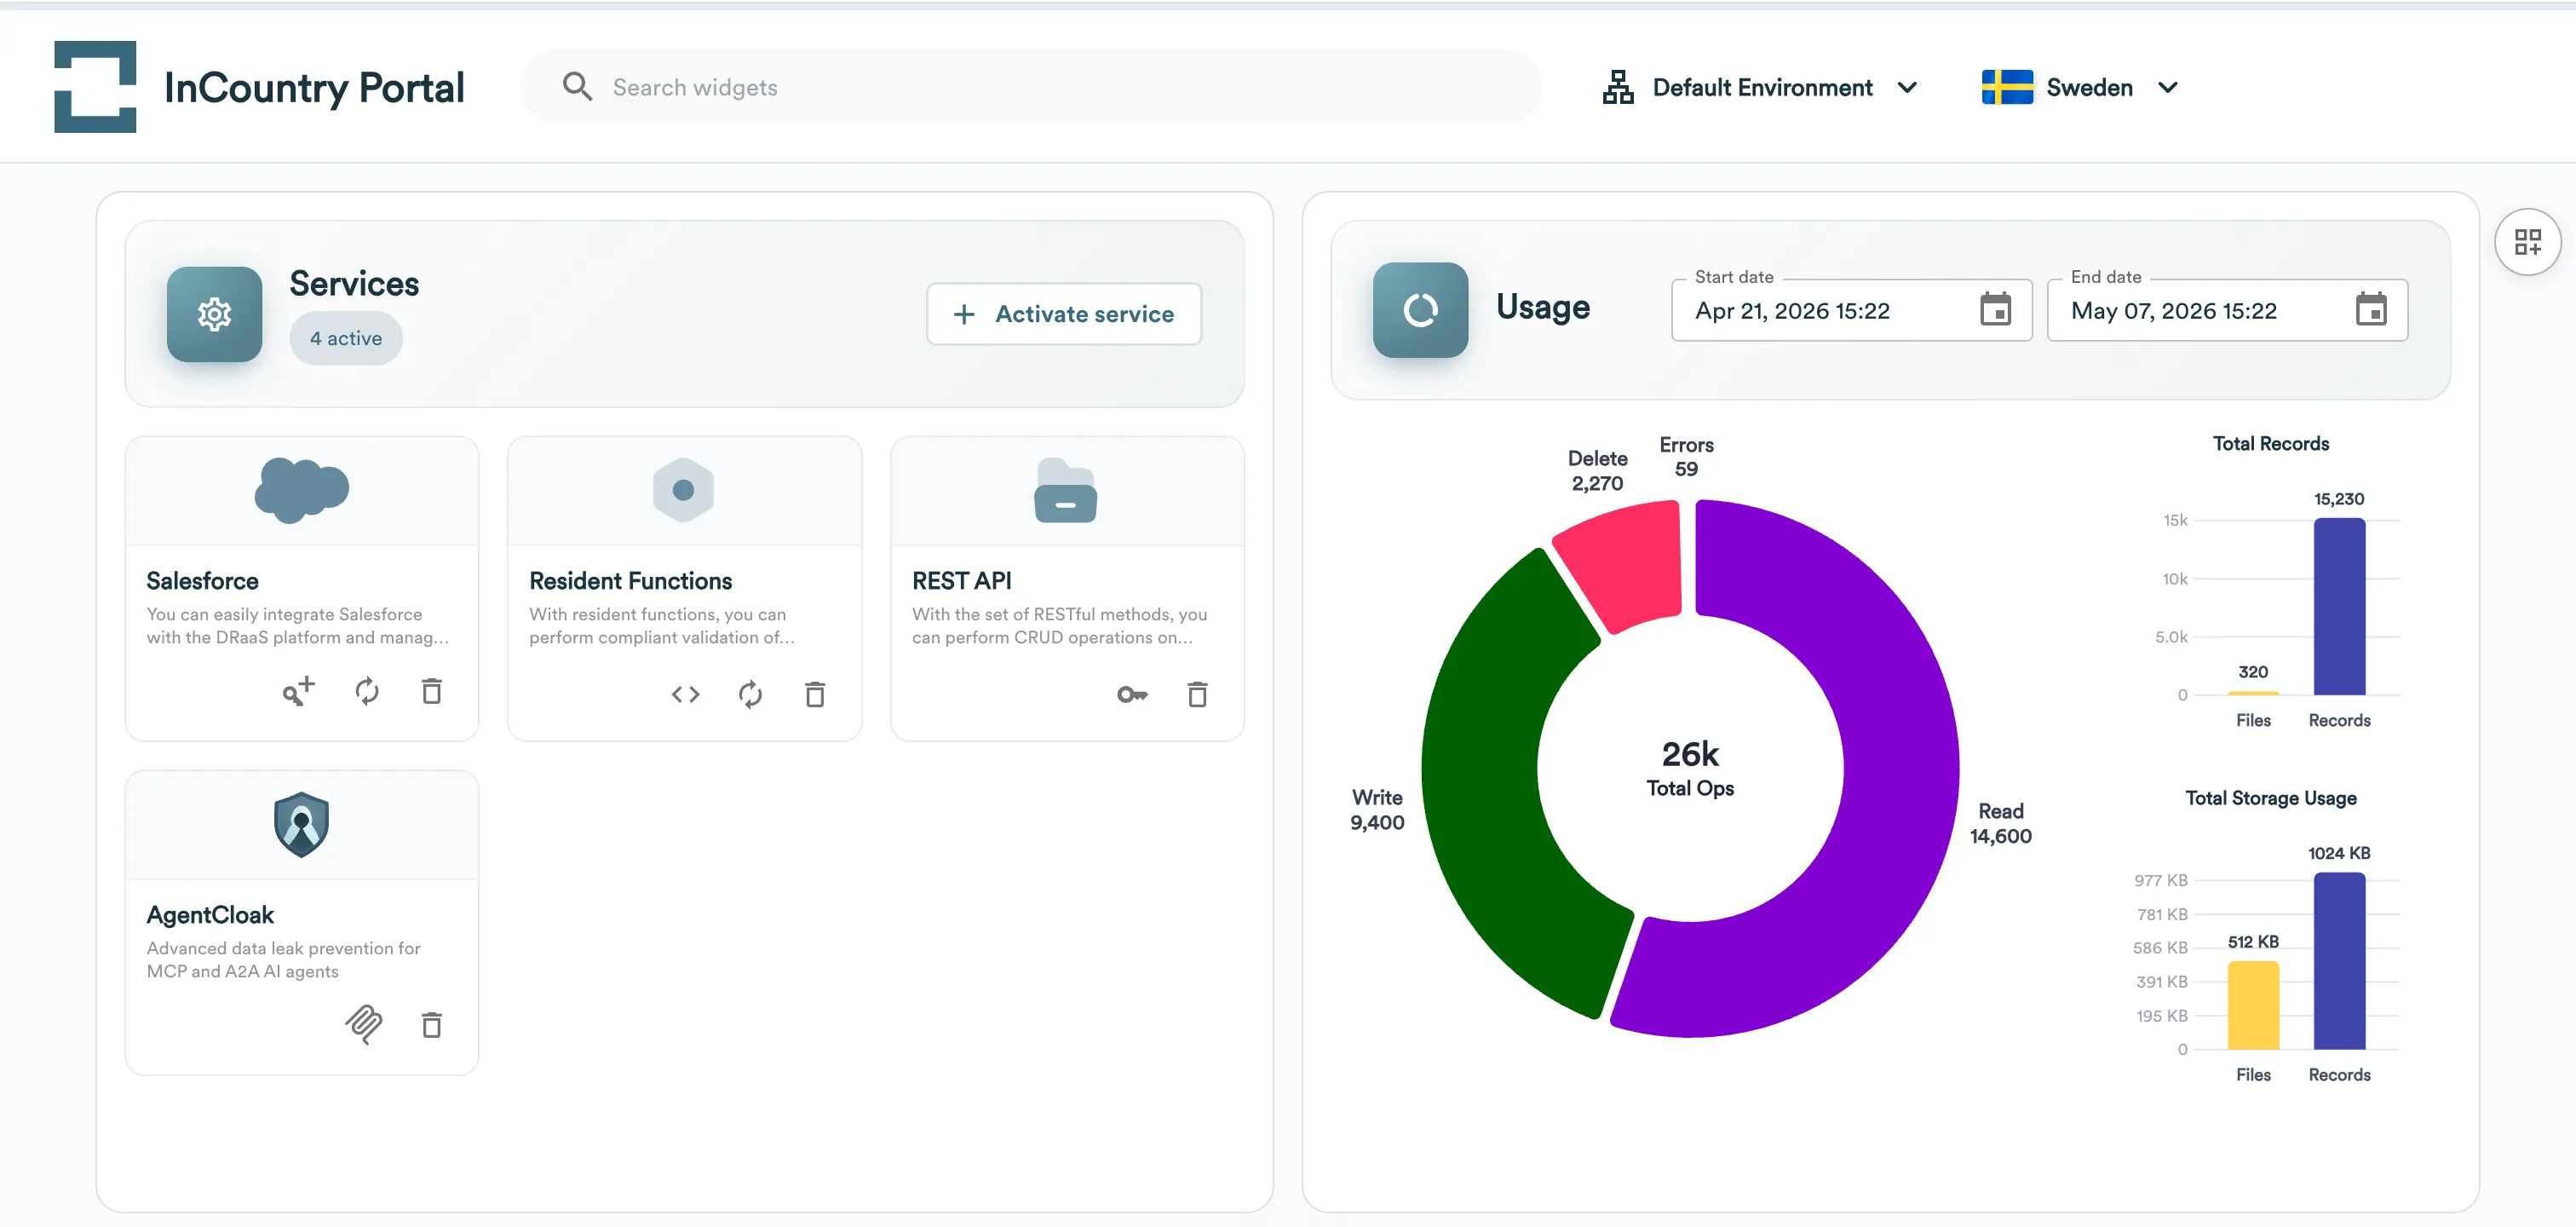
When viewing analytics on transactions, the following information is displayed:

  • Country - name of the country where data transactions were performed.

  • Transactions - number of performed data transactions.

  • Bandwidth - data amount that was transacted to each country.

  • Reads - number of data read operations to each country.

  • Writes - number of data write operations to each country.

  • Deletes - number of data delete operations in each country.

  • Errors - number of errors occurred while performing data transactions.

When viewing analytics on records, the following information is displayed:

  • Country - name of the country where records are stored.

  • Record - number of records stored in each country.

  • Record size - amount of data (records) stored in each country. You can switch the units of measure if needed.

When viewing analytics on files, the following information is displayed:

  • Country - name of the country where files are stored.

  • Files - number of files stored in each country.

  • Files Size - amount of data (files) stored in each country. You can switch the units of measure if needed.

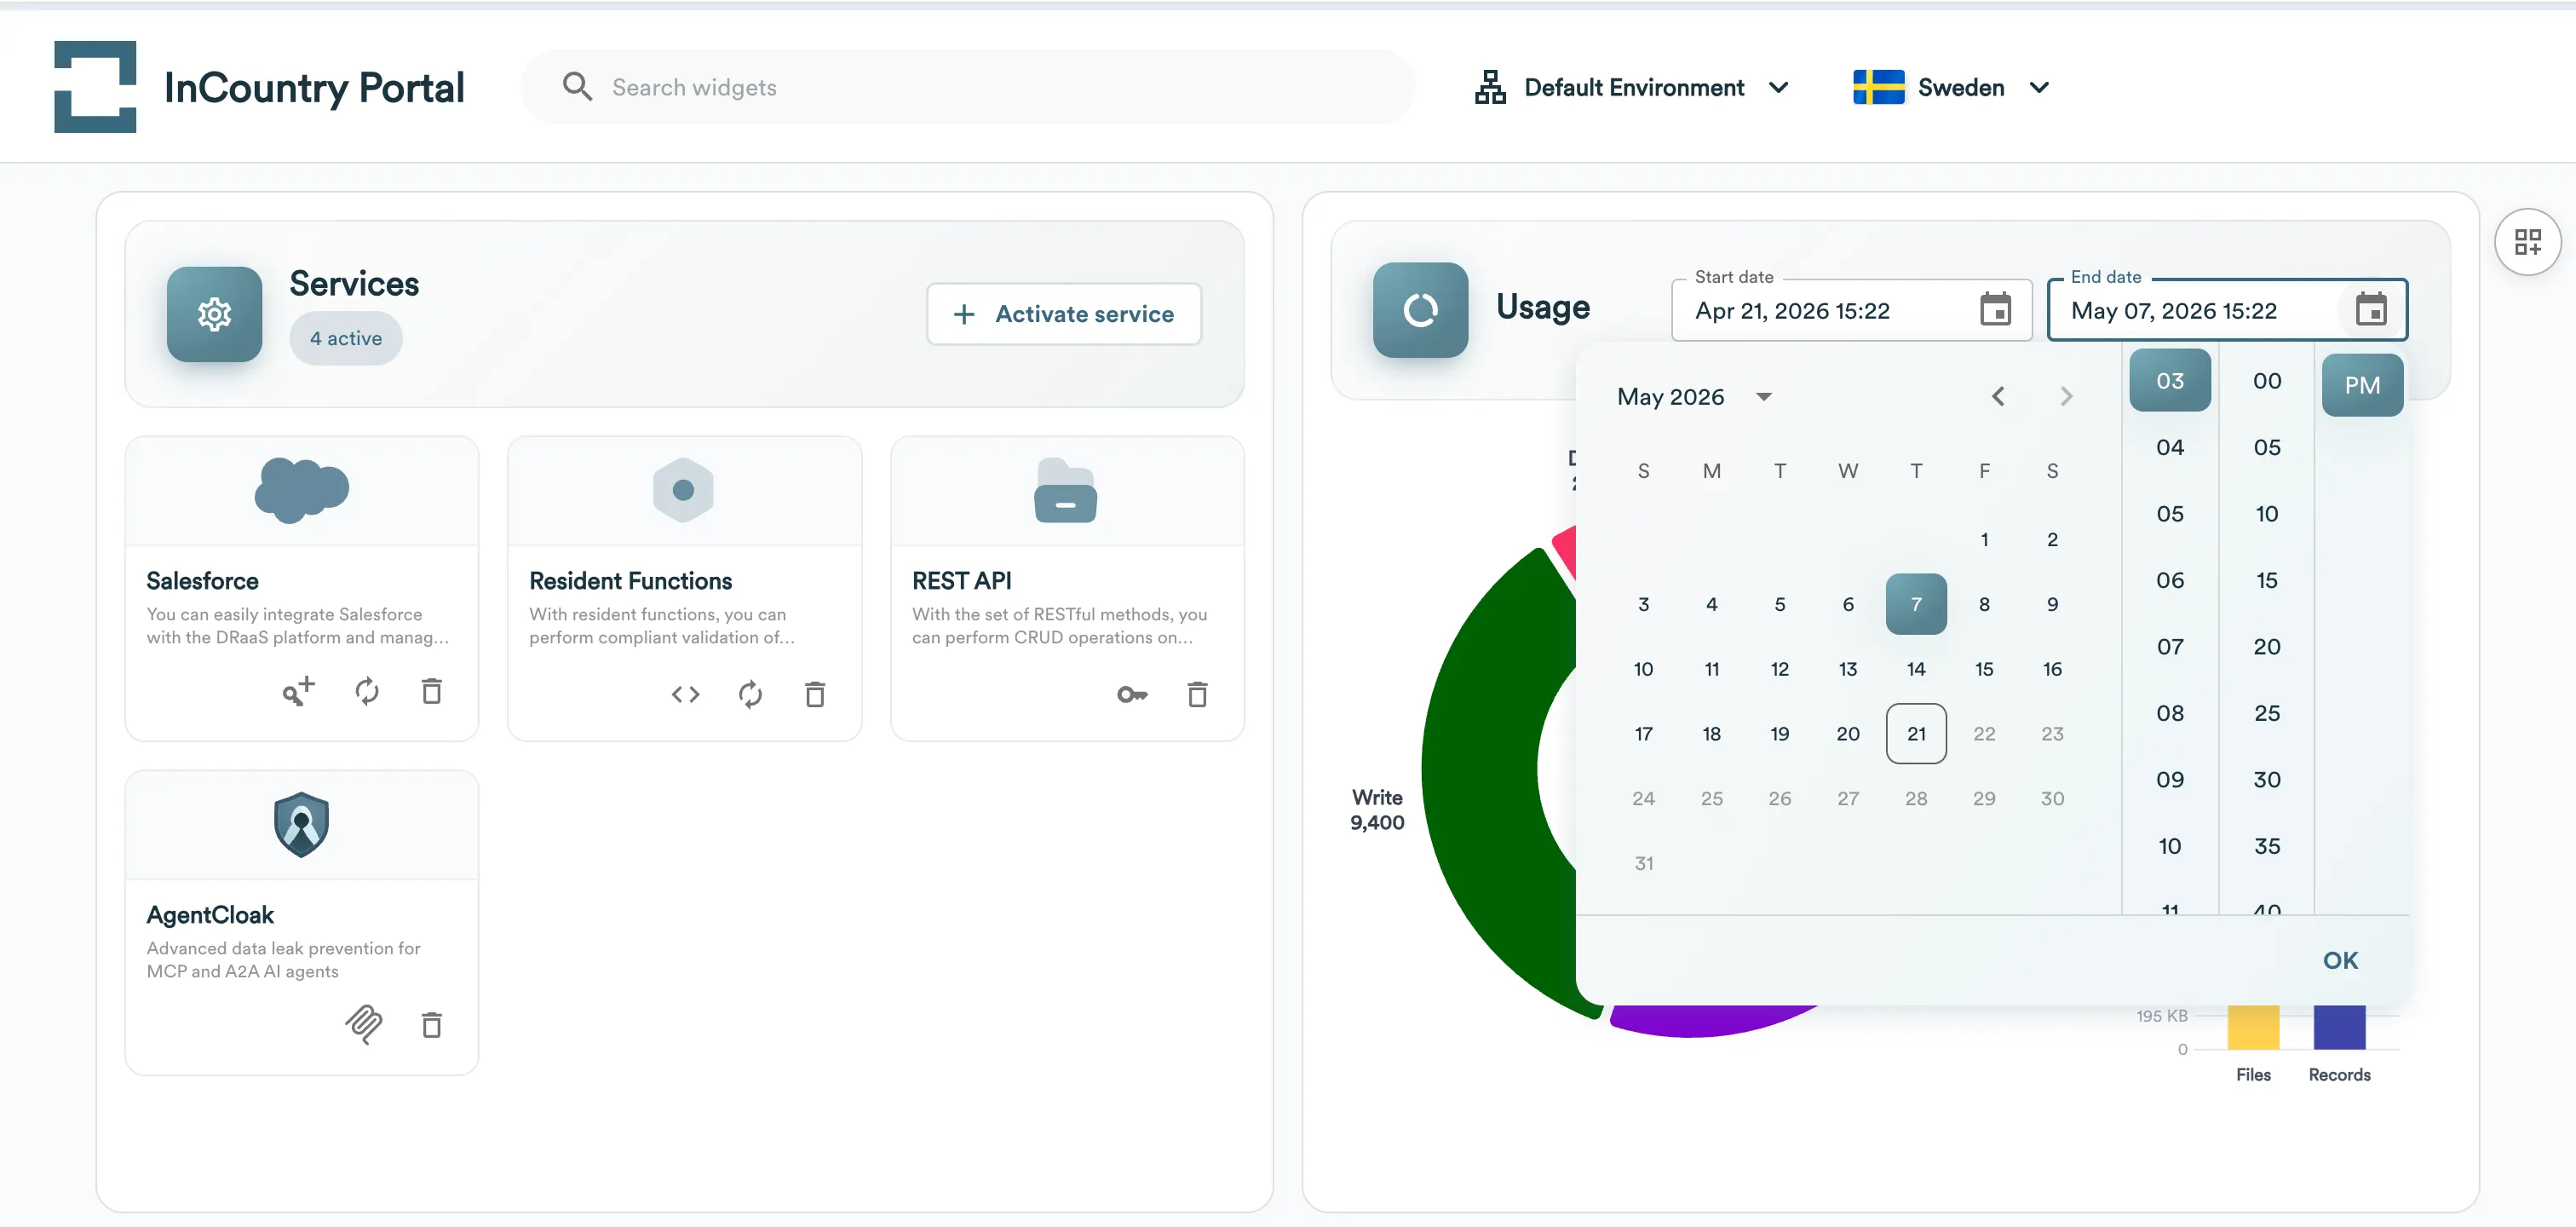
Filtering data in the Usage dashboard

You can use the filter to view data transactions for a specific environment. Click the Environment box and select the environment whose data you want to analyze.

You can use the date filter to view analytics for a specific time frame or as of a specific date.